WA's population is growing fast, and almost all of that growth now comes from migration. Homes haven't kept up. Since 2018-19, the state has added about 427,000 residents but completed only about 114,000 dwellings. Approvals are finally rising, but completions fell last year, and land is scarce and expensive.
Headline figures
-
3,096,200: WA population at 31 Mar 2026, up 64,200 (2.1%) in a year. (ABS National, state and territory population)

-
About 427,000 vs about 114,000: population growth versus dwellings completed, 2018-19 to 2024-25. (ABS ERP; ABS Building Activity)

- 6.4: new residents for every dwelling completed in 2022-23, against an average household of about 2.5 people. (same sources)
-
19,514: dwellings completed in 2025-26, down from 22,436 the year before, while 29,026 were still under construction. (ABS Building Activity)

-
42,300: net overseas migration in 2024-25, the biggest single driver of growth. Natural increase was 13,300. (ABS)

Findings
1. Growth is now mostly migration
-
Fact: Annual population growth went from 53,300 (2019-20) to a peak of 97,000 (2022-23), then 87,200 (2023-24) and 66,900 (2024-25). The 2024-25 components were natural increase 13,300, net overseas migration 42,300 and net interstate migration 11,377. Natural increase has shrunk from 21,400 in 2015-16 (ABS ERP components, via ABS Data API).
-
Fact: Overseas arrivals were 71,700 and departures 29,400 in 2024-25 (net 42,300). The 2022-23 peak was 87,200 in and 20,500 out. In the March quarter 2026, net overseas migration was 14,400, back near the 2023 pace (ABS Overseas Migration).

-
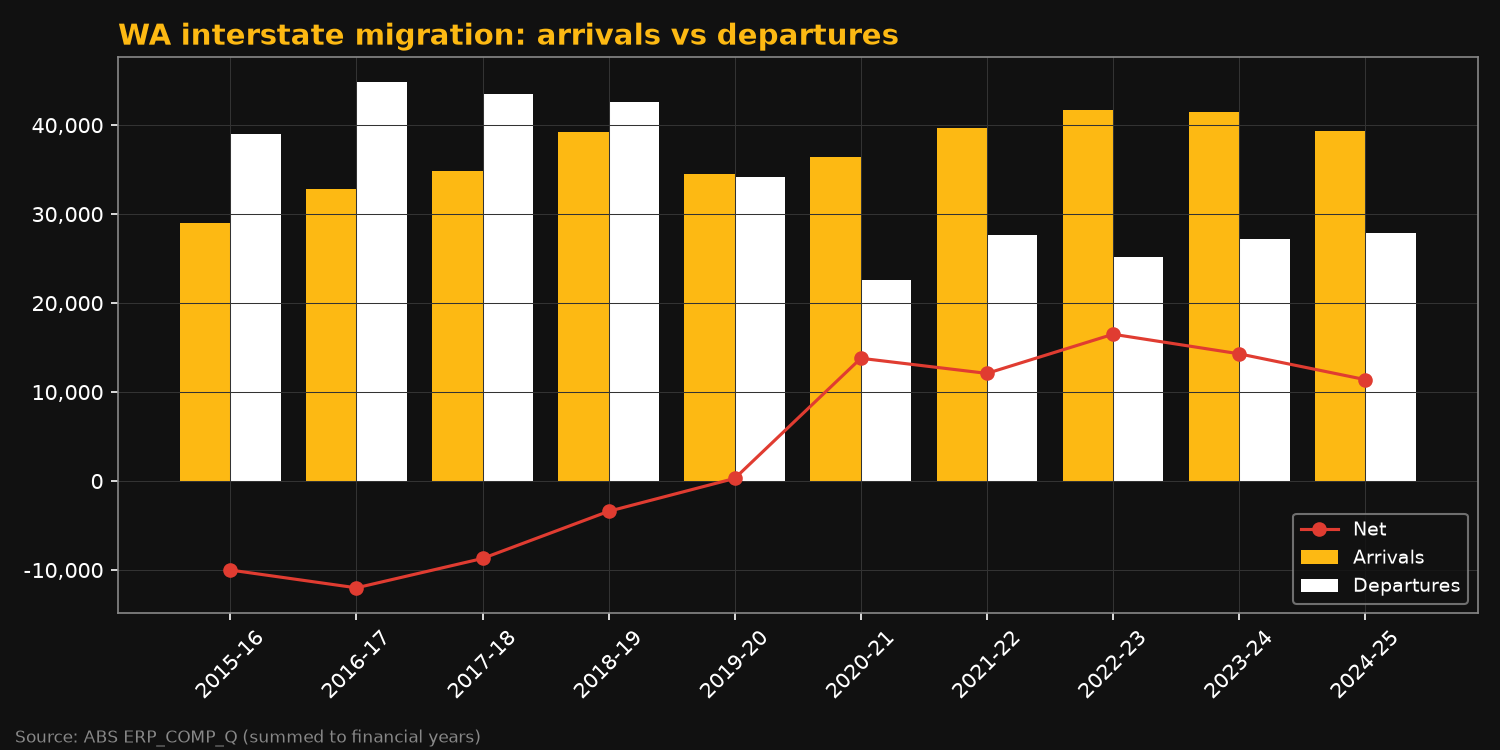
Fact: WA lost people interstate every year from 2013-14 to 2018-19 (for example −11,901 in 2016-17), turned positive in 2019-20, and has seen net interstate inflow fall each year since 2022-23 (16,527 → 11,377) (ABS).
- Our read: Population settings are set mostly in Canberra, but WA's planning and land supply have to absorb the result.
2. Homes haven't kept up with people
-
Fact: From 2018-19 to 2024-25, WA's population grew by about 427,200 and 114,206 dwellings were completed, which is about 3.7 new residents per completed home. In 2022-23 the figure was 6.4. For 2016-17 to 2017-18 it was about 1.3–1.7 (ABS ERP; ABS 8752 Building Activity).
- Our read (calculated): At about 2.5 people per household, 427,200 new residents needed roughly 171,000 homes, but about 114,000 were completed. That's a gap of about 57,000 over seven years. This is rough arithmetic: it ignores demolitions, vacancies and people in non-private dwellings, so treat it as an indicator, not an official shortage figure.
3. Approvals are rising, but completions dipped
-
Fact: Dwelling approvals reached 25,650 in 2025-26 (20,885 houses, 4,765 other), the highest since the HomeBuilder year of 2020-21 (26,937). The low point was 13,974 in 2022-23 (ABS 8731 Building Approvals).

- Fact: In 2025-26, 25,468 dwellings were commenced and 19,514 completed, down from 22,436. At June quarter 2026, 29,026 were under construction (ABS 8752).
- Our read: The pipeline is filling faster than it empties. Construction capacity and approvals time are now the bottleneck, which is exactly where red tape bites (see Green Energy & Red Tape, finding 5).
4. Lot prices (industry claims, not official statistics)
- UDIA WA (industry body) figures: The average Greater Perth lot price was $424,025 in the March quarter 2026, up 18.3% in a year. Only 386 lots were on the market, against a five-year average of 1,237. UDIA's State of the Land 2026 gives a CY2025 median of $377,250 (UDIA WA). These are based on developer-reported sales, not ABS or government data.
Data limits: "people returning to WA"
- Overseas: The ABS counts Australian citizens arriving from overseas to stay (12 of 16 months) by state. In WA in 2022-23, 6,840 arrived and 10,130 left. But an arriving citizen isn't necessarily a former West Australian, and the latest year available through the API is 2022-23.

- Interstate: No official data distinguishes a returning West Australian from a newcomer. ABS interstate figures, based on Medicare address changes, have no "previously lived in WA" flag.
- Census: A custom ABS TableBuilder query (WA-born, living interstate five years earlier) could estimate returners for 2021. No published estimate exists. 2026 Census results, due in 2027, may allow one.
What we'd do: Let WA build
- Statutory deadlines for subdivision, clearing and building approvals, with deemed approval if a deadline is missed.
- Publish lot creation, titles and approval times every quarter as open data, not PDFs.
- Cut stamp duty and government charges on new homes and land. Make developer contributions transparent and capped.
- Release surplus government land with title-ready approvals.
- Measure housing policy by homes completed per new resident, published every quarter.